
{\setbeamertemplate{footline}{}\setbeamertemplate{headline}{}\frame{\titlepage}}
\addtocounter{framenumber}{-1}
The Beamer package enables LaTeX to produce high quality technical presentations and can be used in combination with the TikZ package for including publication-quality diagrams in presentations. However, formatting LaTeX presentations using Beamer and TikZ is difficult and time consuming, so I often reuse code snippets from previous presentations.
The following is my ongoing personal collection of snippets contained in the bamos/beamer-snippets repository on GitHub. This repository is MIT-licensed and can be cloned or forked to host your own snippets. I'm happy to add links to other collections here.
To use these, copy and paste the code from the base document to a new LaTeX document and compile it for a starting point. See here for a further introduction to LaTeX.
{\setbeamertemplate{footline}{}\setbeamertemplate{headline}{}\frame{\titlepage}}
\addtocounter{framenumber}{-1}

\frame{\frametitle{Table of Contents.}\tableofcontents}
\frame{\frametitle{\insertsection}\framesubtitle{\insertsubsection}
  \begin{center}
    \begin{tabular}{lp{0.8\textwidth}}
      \uncheckedBox & Task A \\
      \uncheckedBox & Task B \\
      \checkedBox & Task C \\
    \end{tabular}
  \end{center}
}
\begin{frame}[fragile]
\frametitle{\insertsection}\framesubtitle{\insertsubsection}
\begin{lstlisting}[language=scala,keywordstyle=\bf,stringstyle=\it]
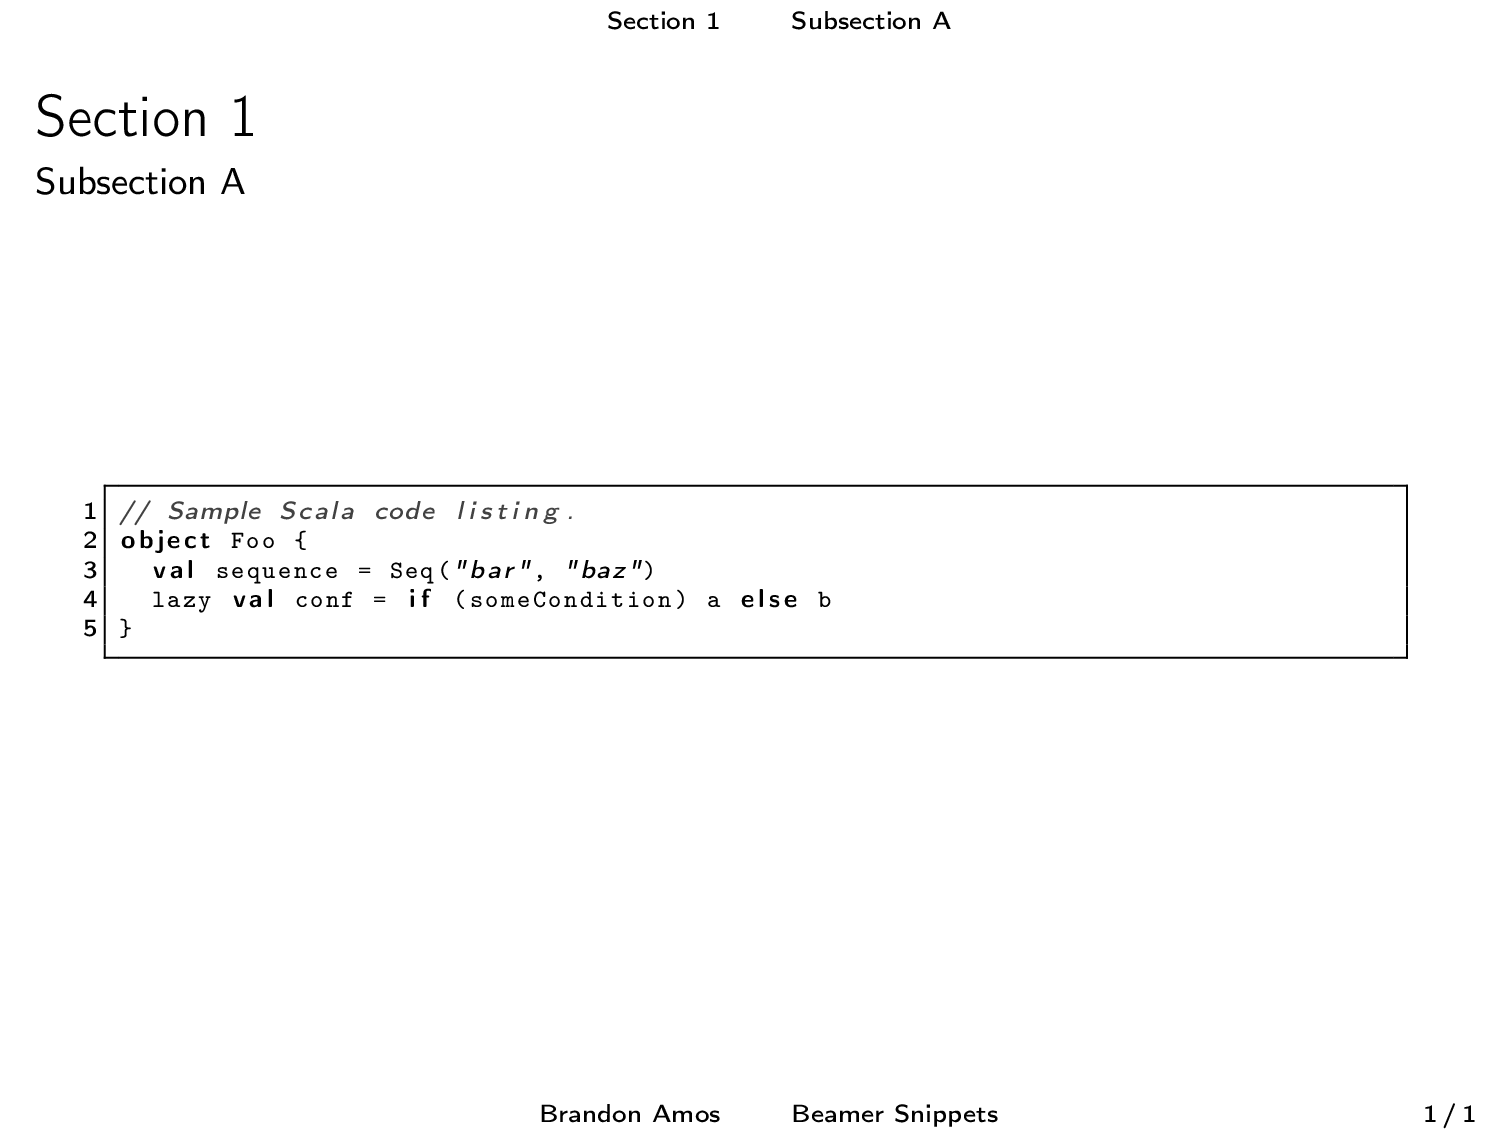
// Sample Scala code listing.
object Foo {
val sequence = Seq("bar", "baz")
lazy val conf = if (someCondition) a else b
}
\end{lstlisting}
\end{frame}
\frame{\frametitle{\insertsection}\framesubtitle{\insertsubsection}
\scalebox{0.7}{
\begin{tikzpicture}
\draw[fill=gray!20] (-1.7cm,-1.1cm) rectangle (3.9cm,1.3cm) {};
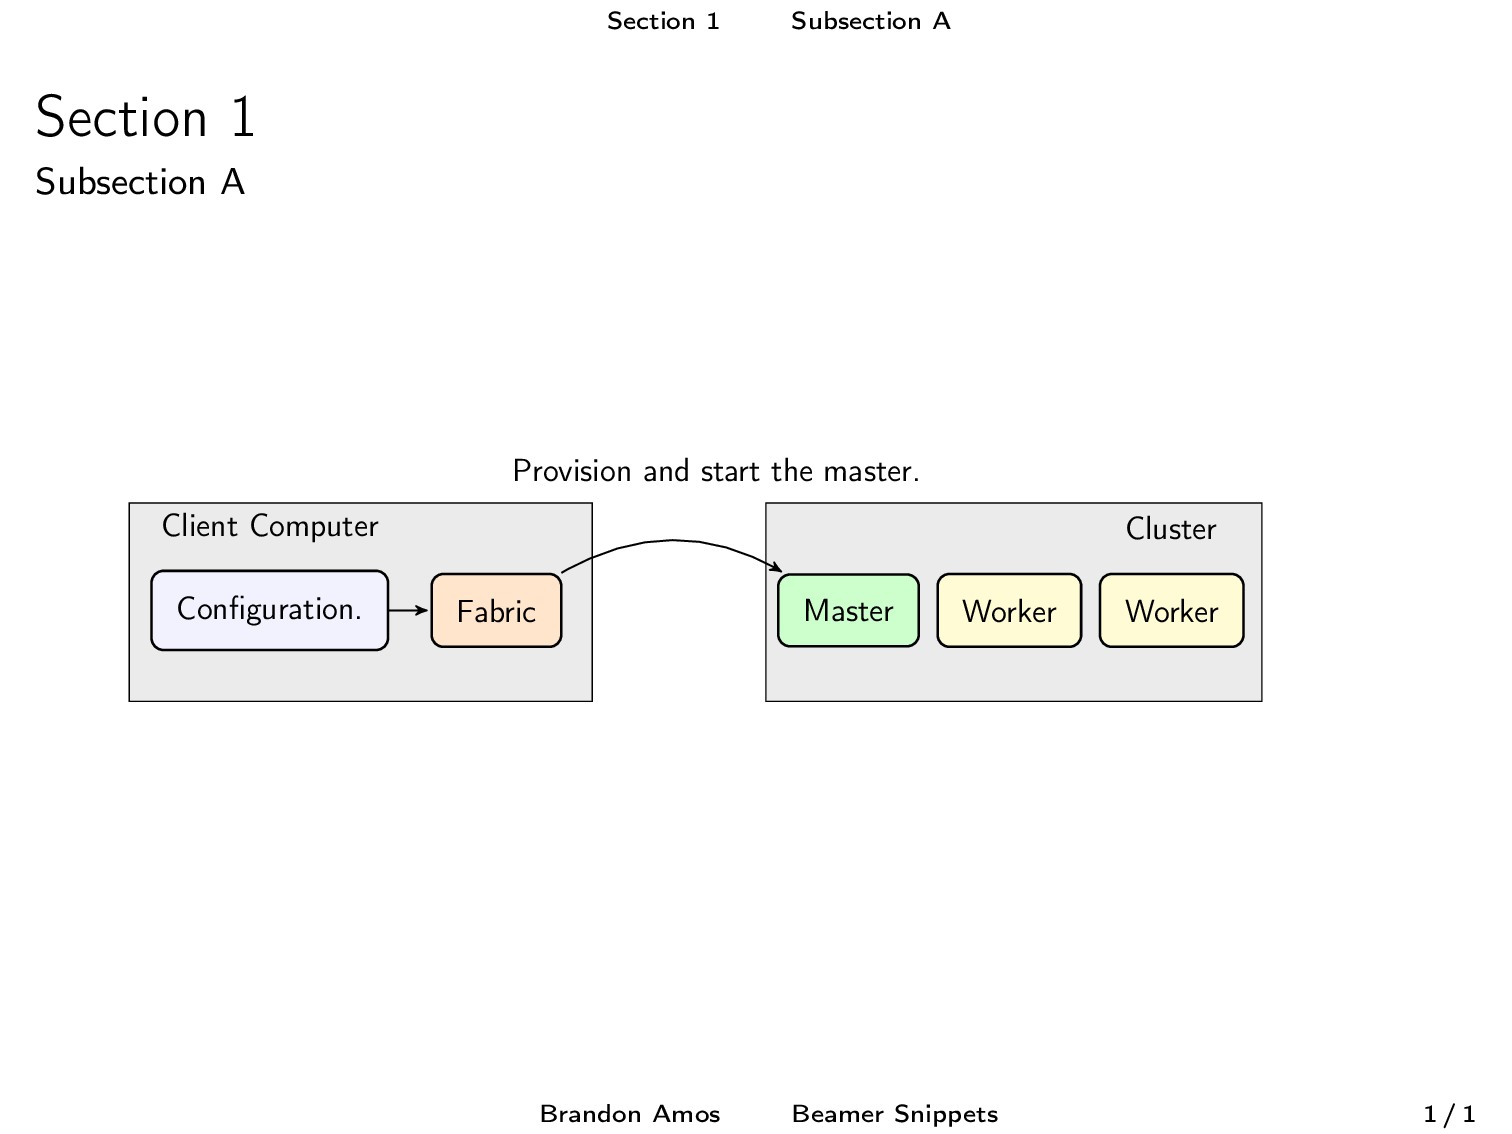
\node[bn] (config) {Configuration.};
\node[on,right=0.5cm of config] (fabric) {Fabric};
\node at (0cm,1cm) () {Client Computer};
\draw[to] (config) -- (fabric);
\draw[fill=gray!20] (6cm,-1.1cm) rectangle (12cm,1.3cm) {};
\node[greenn] (m) at (7.0cm,0cm) {Master};
\node[yn,right=0.2cm of m] (w1) {Worker};
\node[yn,right=0.2cm of w1] (w2) {Worker};
\node at (10.9cm,1cm) {Cluster};
\node at (5.4cm,1.7cm) {Provision and start the master.};
\draw[to] (fabric) edge [bend left] (m);
\end{tikzpicture}
}
}
\frame{\frametitle{\insertsection}\framesubtitle{\insertsubsection}
\begin{center}
\scalebox{0.7}{
\begin{tikzpicture}
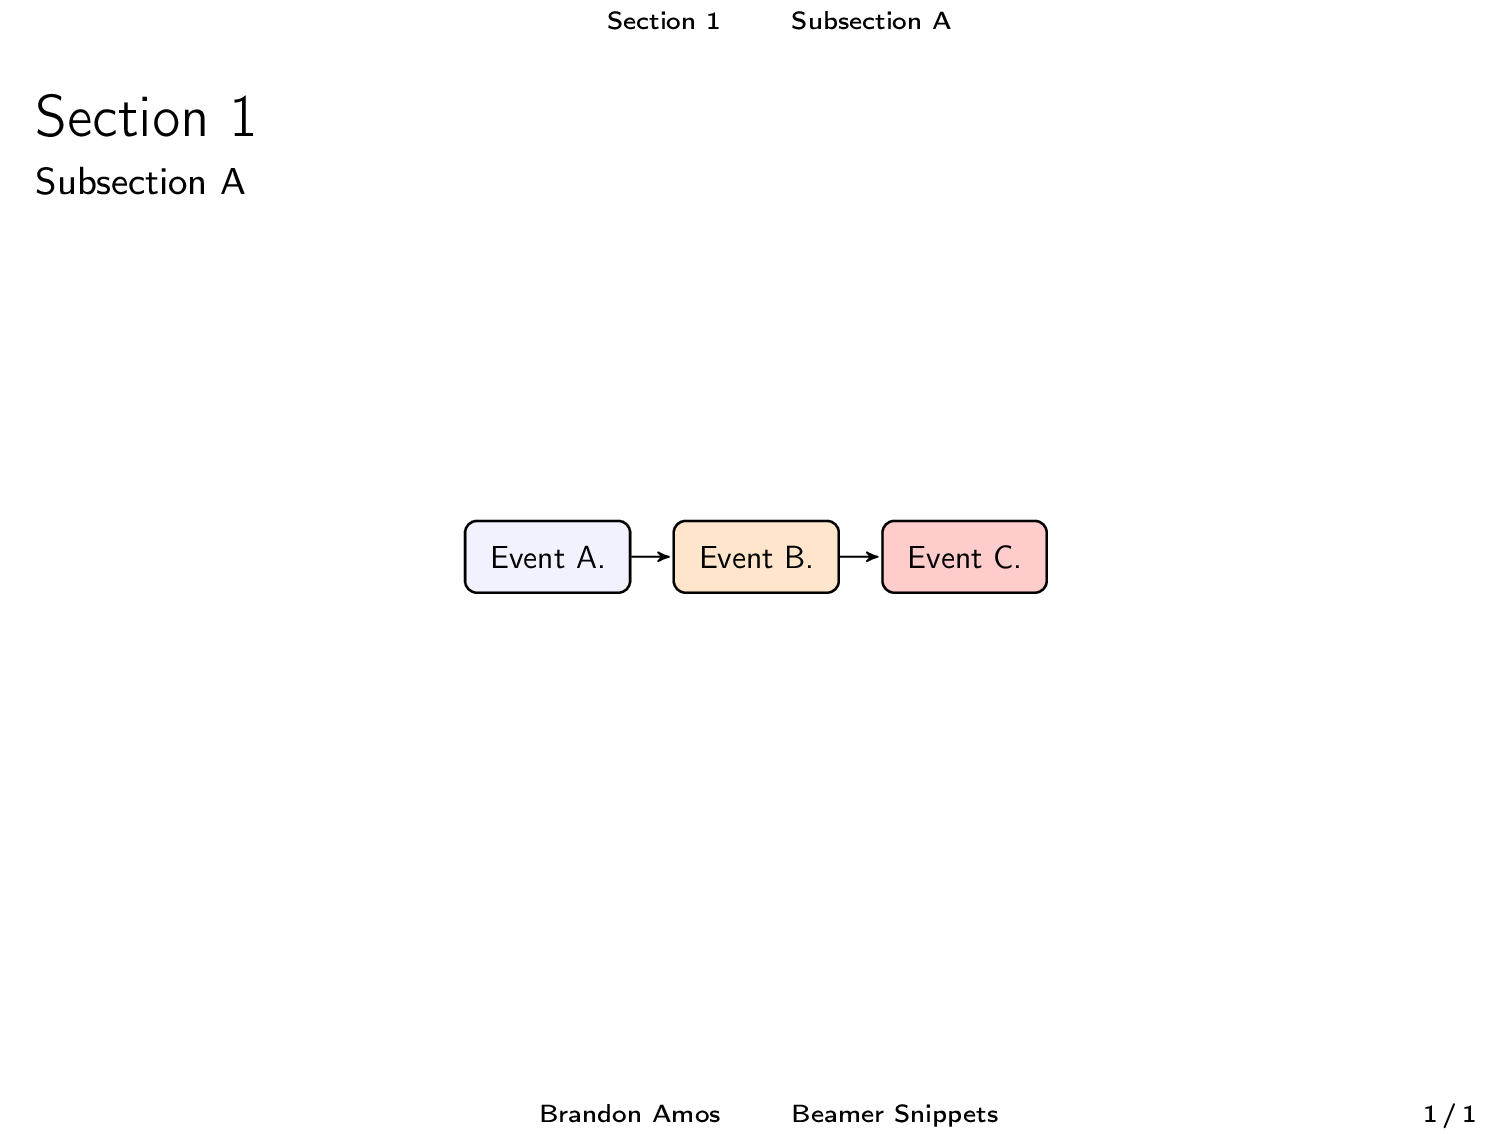
\node[bn] (a) {Event A.};
\node[on,right=0.5cm of a] (b) {Event B.};
\node[rn,right=0.5cm of b] (c) {Event C.};
\draw[to] (a) -- (b);
\draw[to] (b) -- (c);
\end{tikzpicture}
}
\end{center}
}
\frame{\frametitle{\insertsection}\framesubtitle{\insertsubsection}
  \begin{itemize}
    \foreach \val in {Lorem ipsum,dolor sit,amet.} { \item \val }
  \end{itemize}
}
\frame{\frametitle{\insertsection}\framesubtitle{\insertsubsection}
  \begin{itemize}
    \item Lorem ipsum dolor sit amet.
    \item Consectetuer adipiscing elit.
      \begin{multicols}{2}
        \foreach \i in {1,...,10} {\item \i}
      \end{multicols}
    \item Aenean commodo ligula eget dolor.
  \end{itemize}
}
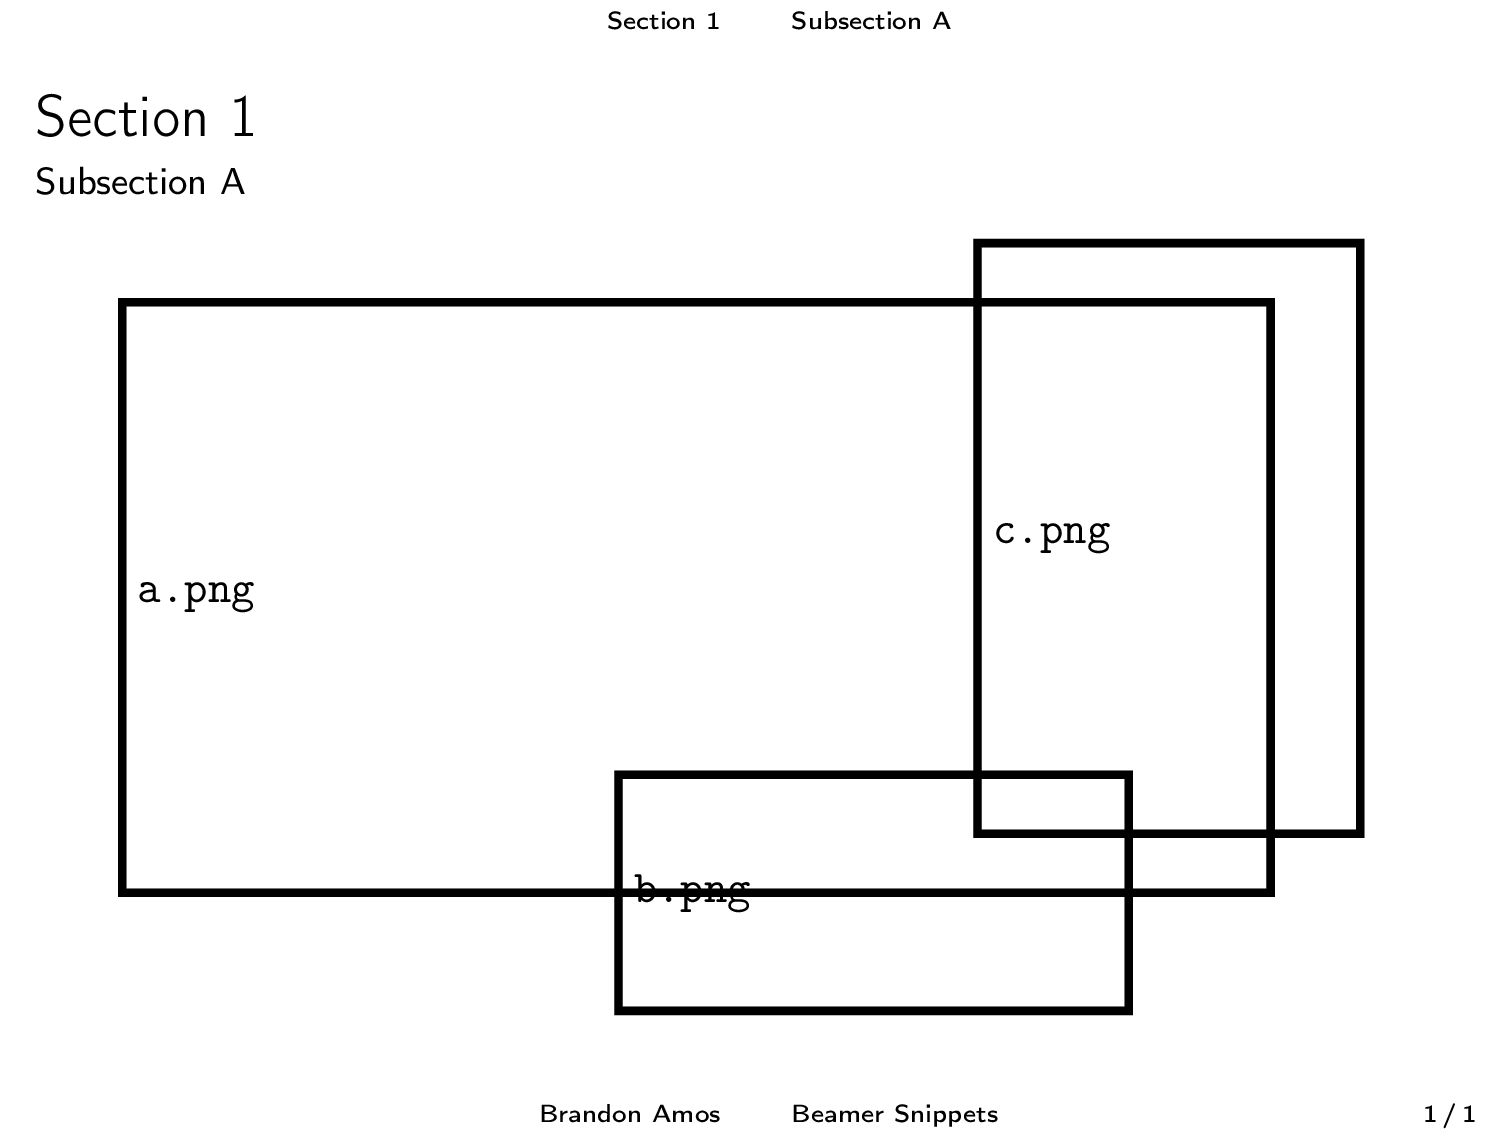
\frame{\frametitle{\insertsection}\framesubtitle{\insertsubsection}
  \begin{tikzpicture}[
    every node/.style={draw,line width=2pt,inner sep=0,outer sep=0}]
\node at (0,0) () {\includegraphics[draft,width=0.9\textwidth,height=5cm]{a.png}};
\node at (1.5,-2.5) () {\includegraphics[draft,width=0.4\textwidth,height=2cm]{b.png}};
\node at (4,0.5) () {\includegraphics[draft,width=0.3\textwidth,height=5cm]{c.png}};
  \end{tikzpicture}
}
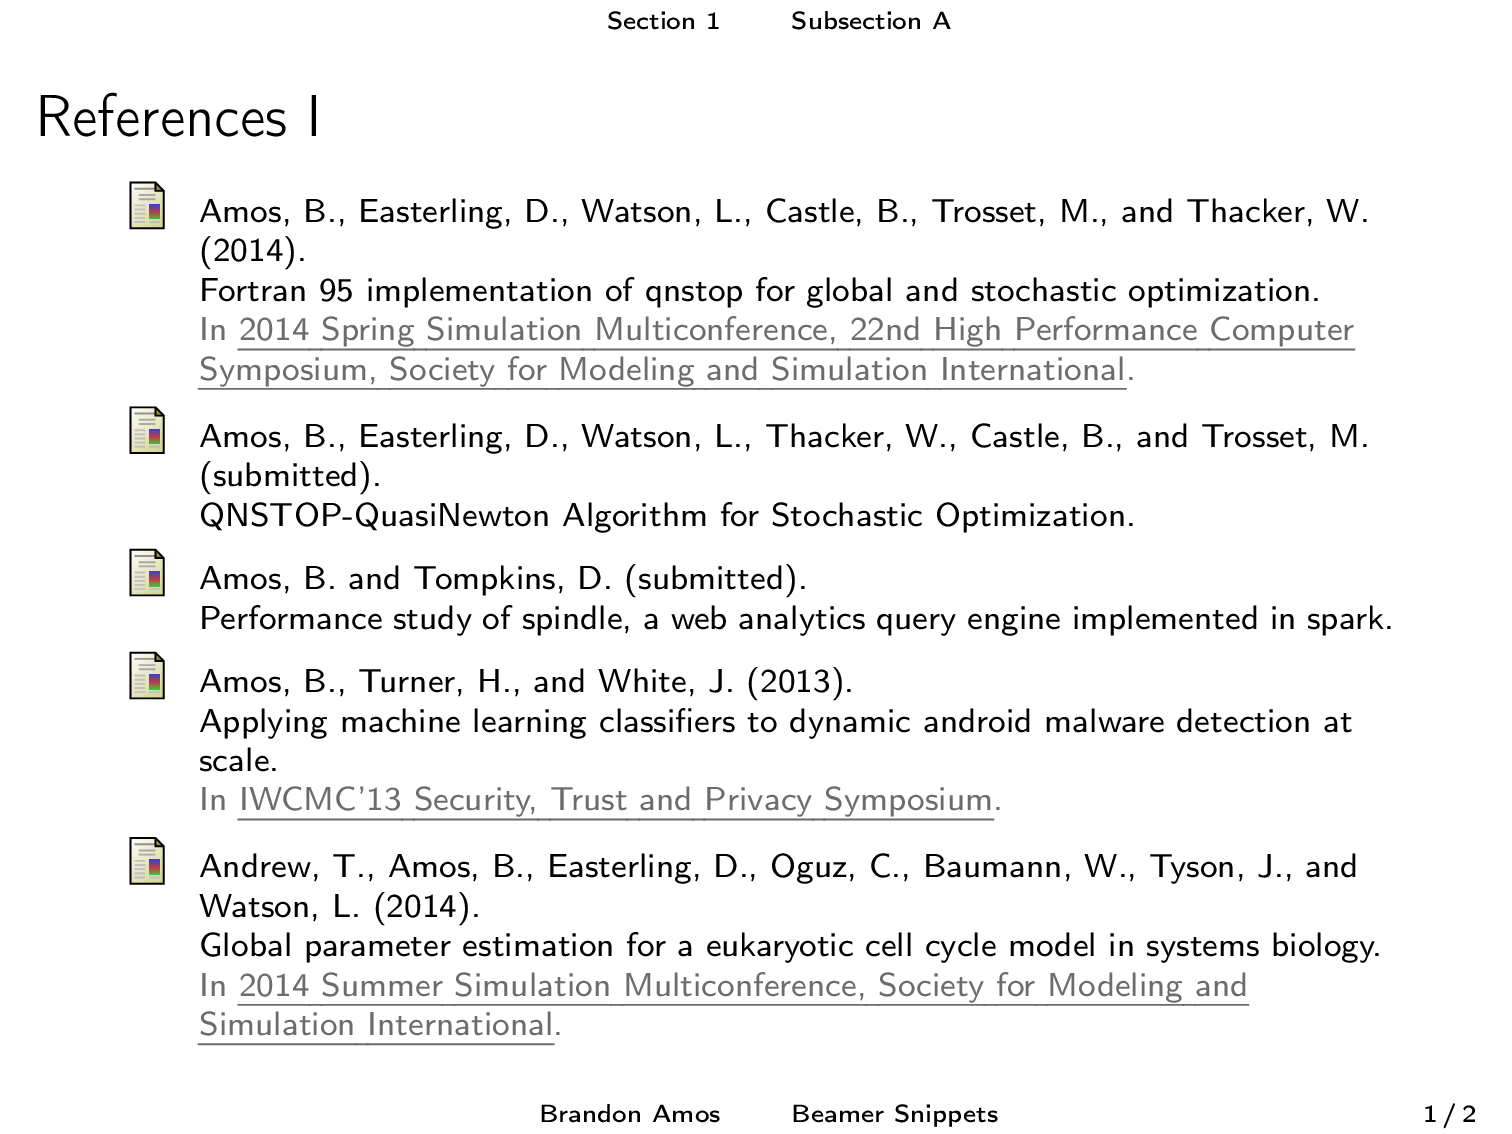
\begin{frame}[fragile,allowframebreaks]
  % In your presentation, remove `\nocite` here and
  % use `\cite` throughout the presentation.
  \nocite{*}

  \frametitle{References}
  \scriptsize
  \bibliographystyle{apalike}
  \bibliography{refs}
\end{frame}
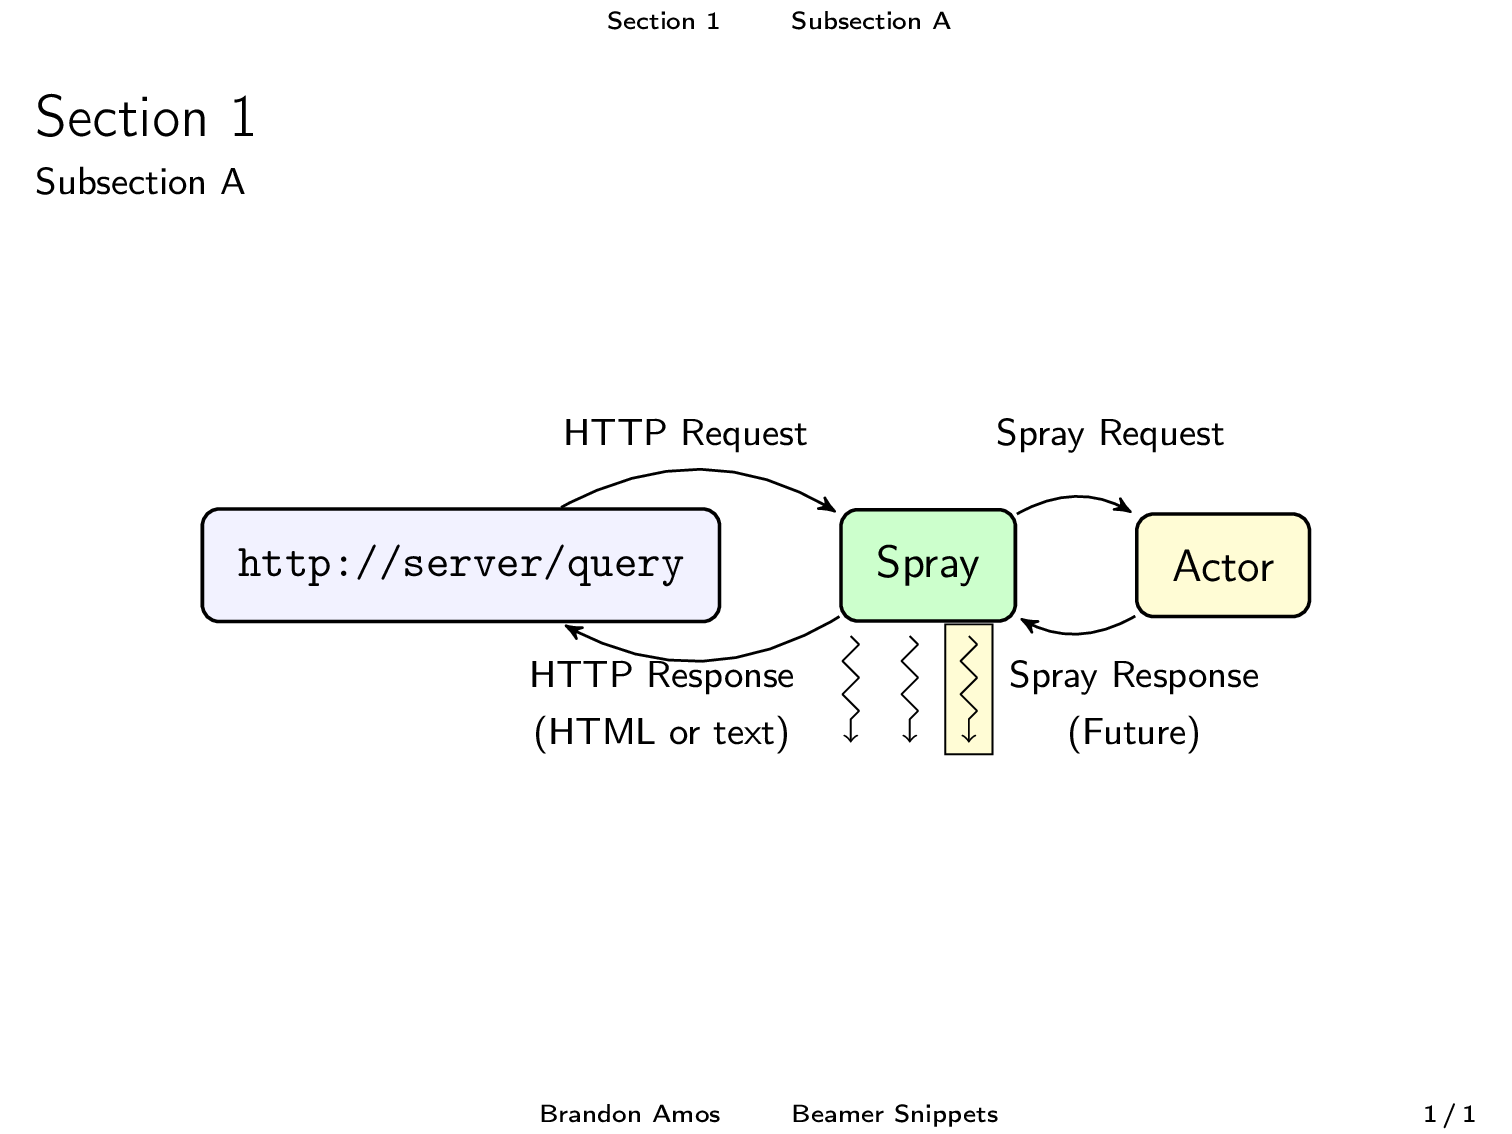
\frame{\frametitle{\insertsection}\framesubtitle{\insertsubsection}
  \begin{center}
  \begin{tikzpicture}
    \node[bn] (query) {{\tt http://server/query}};

    \node[greenn,right=of query] (spray) {Spray};
    \draw[squig] (3.3cm,-0.6cm) -- (3.3cm,-1.5cm);
    \draw[squig] (3.8cm,-0.6cm) -- (3.8cm,-1.5cm);
    \draw[fill=yellow!20] (4.1cm,-1.6cm) rectangle (4.5cm,-0.5cm) {};
    \draw[squig] (4.3cm,-0.6cm) -- (4.3cm,-1.5cm);
    \node[yn,right=of spray] (actor) {Actor};

    \node at (1.9cm,1.1cm) {{\footnotesize HTTP Request}};
    \node at (1.7cm,-1.2cm) {{\footnotesize HTTP Response}\\{\footnotesize (HTML or text)}};
    \draw[to] (query) edge [bend left] (spray);
    \draw[to] (spray) edge [bend left] (query);

    \node at (5.5cm,1.1cm) {{\footnotesize Spray Request}};
    \node at (5.7cm,-1.2cm) {{\footnotesize Spray Response} \\ {\footnotesize (Future)}};
    \draw[to] (spray) edge [bend left] (actor);
    \draw[to] (actor) edge [bend left] (spray);
  \end{tikzpicture}
  \end{center}
}
\frame{\frametitle{\insertsection}\framesubtitle{\insertsubsection}
  \begin{itemize}
    \item Lorem ipsum dolor sit amet.
    \item Consectetuer adipiscing elit.
    \item Aenean commodo ligula eget dolor.
  \end{itemize}
}
\frame{\frametitle{\insertsection}\framesubtitle{\insertsubsection}
  \includegraphics[draft,width=0.9\textwidth,height=5cm]{a.png}
}
\frame{\frametitle{\insertsection}\framesubtitle{\insertsubsection}
  \begin{center}
    \begin{tabular}{cc}
      Lorem & ipsum \\ \hline
      dolor & sit \\
      amet. & Consectetuer \\
      adipiscing & elit.
    \end{tabular}
  \end{center}
}
\frame{\frametitle{\insertsection}\framesubtitle{\insertsubsection}
\begin{center}
\scalebox{0.75}{
\begin{tikzpicture}
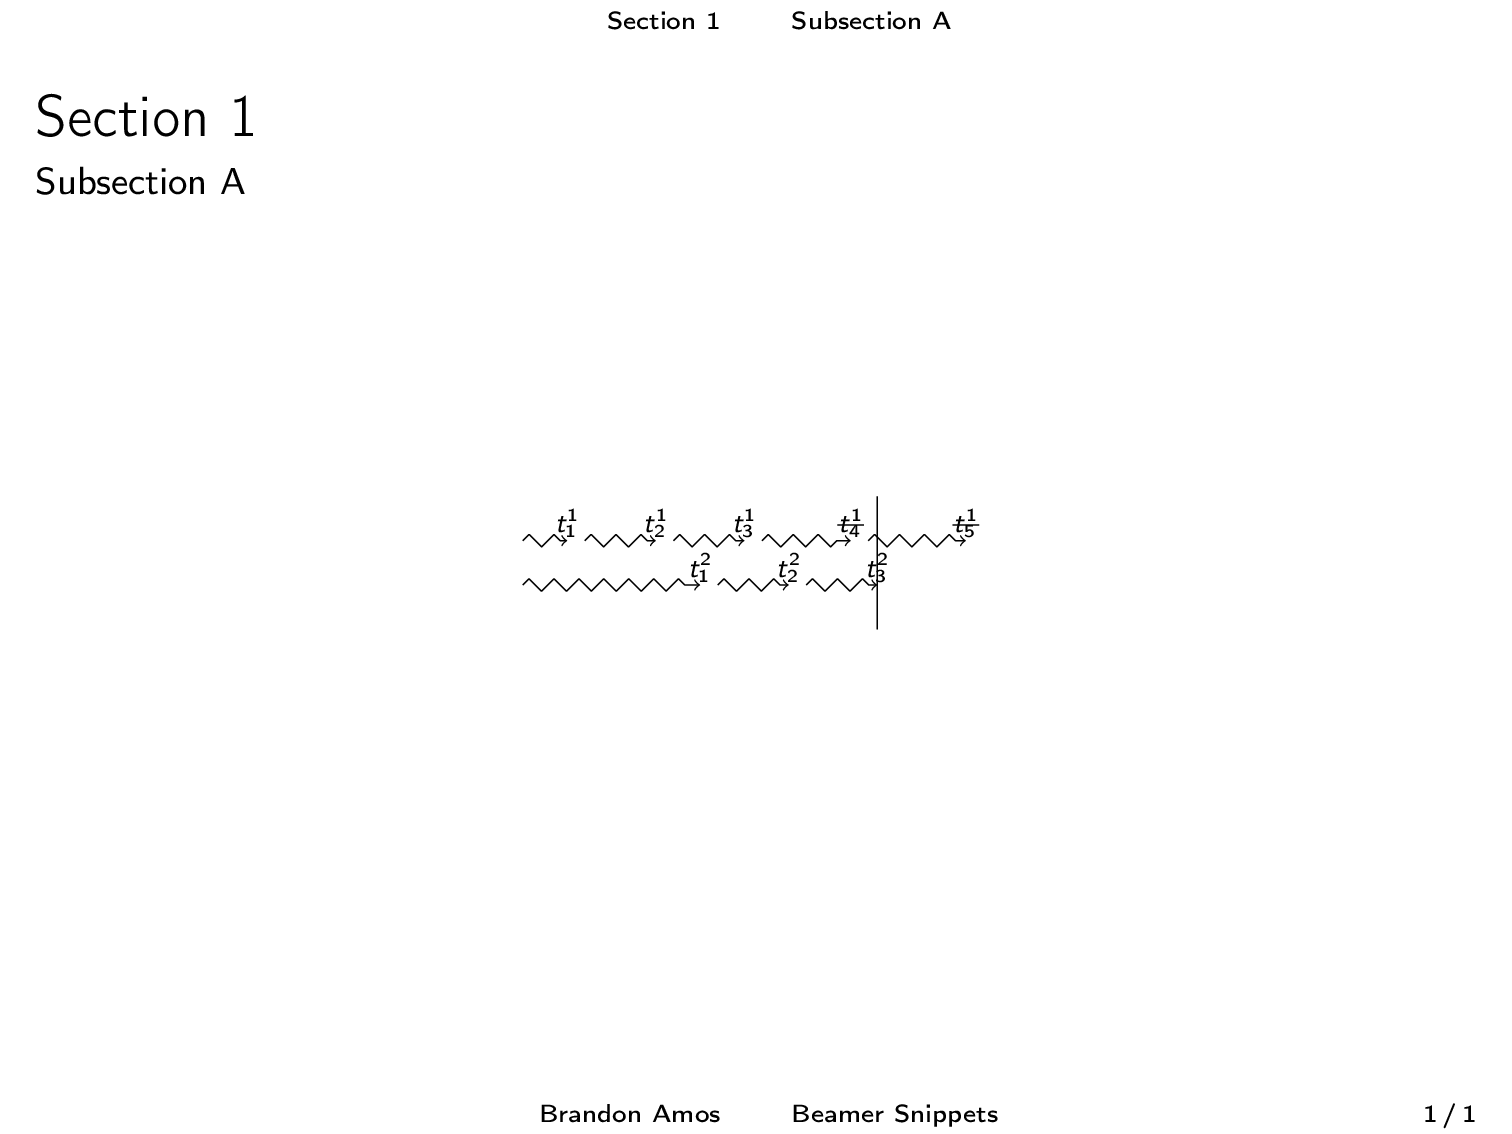
\draw[squig] (0,0) -- (2,0);\node at (2,0.2) {{\footnotesize $t_1^2$}};
\draw[squig] (2.2,0) -- (3,0);\node at (3,0.2) {{\footnotesize $t_2^2$}};
\draw[squig] (3.2,0) -- (4,0);\node at (4,0.2) {{\footnotesize $t_3^2$}};
\draw[squig] (0,0.5) -- (0.5,0.5);\node at (0.5,0.7)
{{\footnotesize $t_1^1$}};
\draw[squig] (0.7,0.5) -- (1.5,0.5);\node at (1.5,0.7)
{{\footnotesize $t_2^1$}};
\draw[squig] (1.7,0.5) -- (2.5,0.5);\node at (2.5,0.7)
{{\footnotesize $t_3^1$}};
\draw[squig] (2.7,0.5) -- (3.7,0.5);\node at (3.7,0.7)
{{\footnotesize \sout{$t_4^1$}}};
\draw[squig] (3.9,0.5) -- (5.0,0.5);\node at (5.0,0.7)
{{\footnotesize \sout{$t_5^1$}}};
\draw (4,-0.5) -- (4,1);
\end{tikzpicture}
}
\end{center}
}
% Reference: http://stackoverflow.com/questions/217834
\frame{\frametitle{\insertsection}\framesubtitle{\insertsubsection}
\begin{center}
\begin{tikzpicture}[
snake=zigzag,line before snake=5mm,line after snake=5mm
]
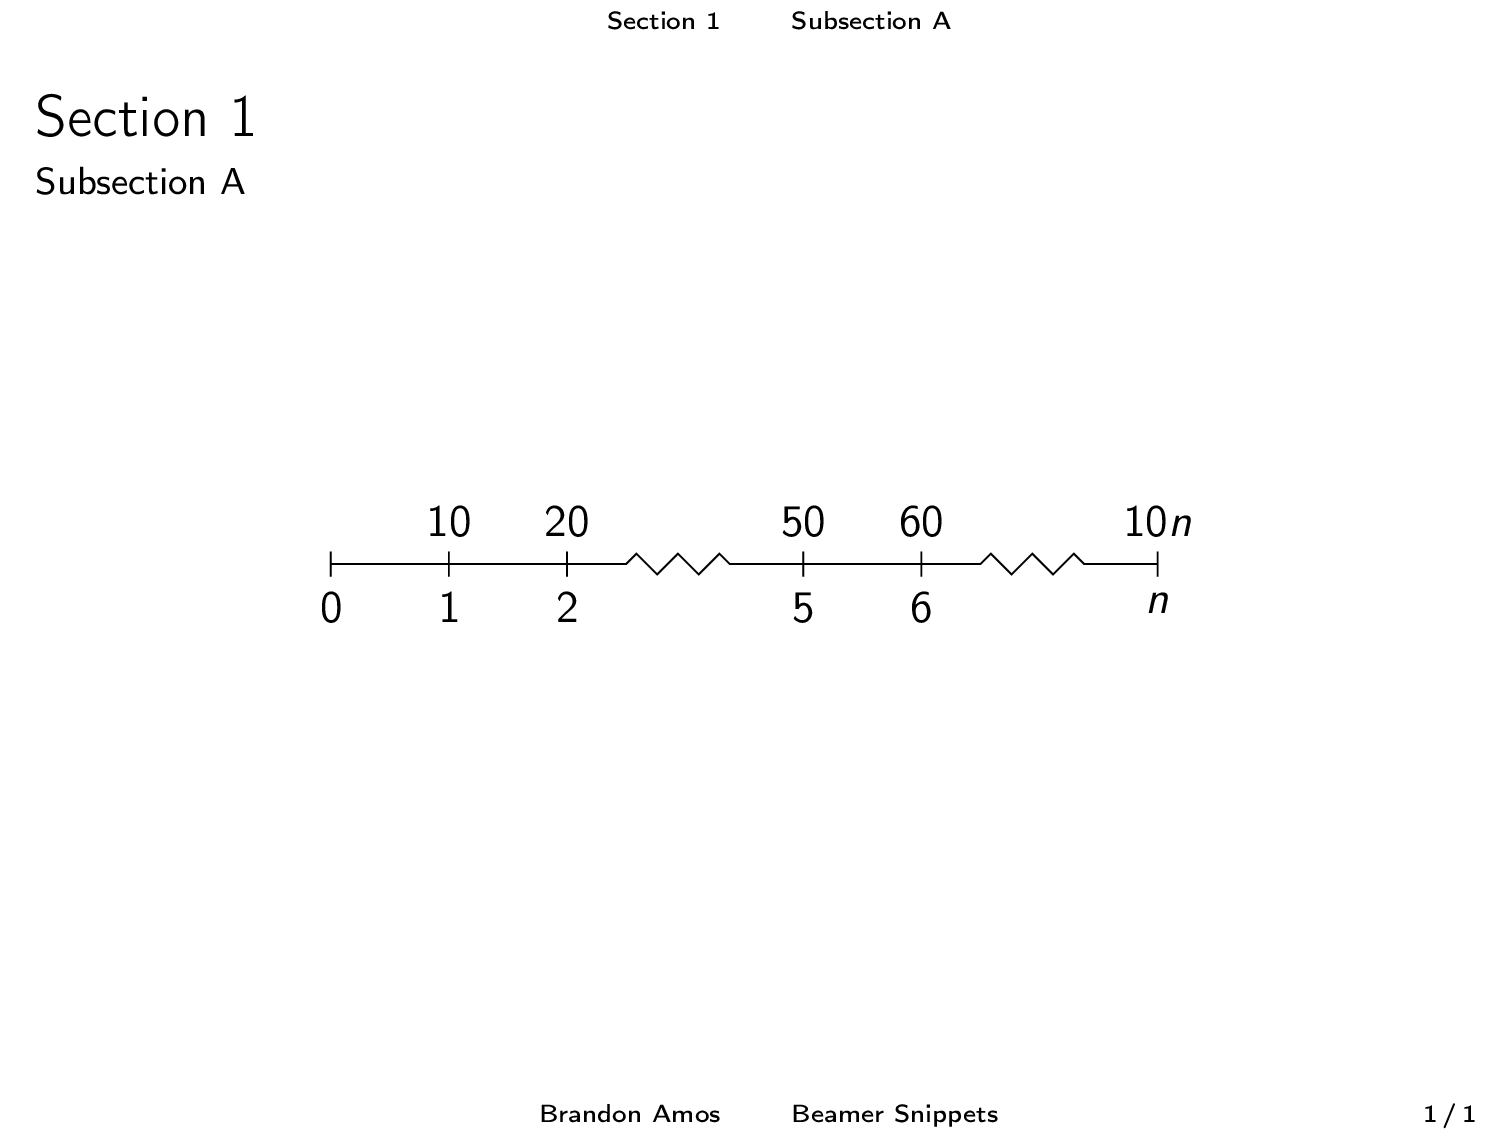
\draw (0,0) -- (2,0);
\draw[snake] (2,0) -- (4,0);
\draw (4,0) -- (5,0);
\draw[snake] (5,0) -- (7,0);
\foreach \x in {0,1,2,4,5,7} \draw (\x cm,3pt) -- (\x cm,-3pt);
\draw (0,0) node[below=3pt] {$ 0 $} node[above=3pt] {$ $};
\draw (1,0) node[below=3pt] {$ 1 $} node[above=3pt] {$ 10 $};
\draw (2,0) node[below=3pt] {$ 2 $} node[above=3pt] {$ 20 $};
\draw (3,0) node[below=3pt] {$ $} node[above=3pt] {$ $};
\draw (4,0) node[below=3pt] {$ 5 $} node[above=3pt] {$ 50 $};
\draw (5,0) node[below=3pt] {$ 6 $} node[above=3pt] {$ 60 $};
\draw (6,0) node[below=3pt] {$ $} node[above=3pt] {$ $};
\draw (7,0) node[below=3pt] {$ n $} node[above=3pt] {$ 10n $};
\end{tikzpicture}
\end{center}
}
\frame{\frametitle{\insertsection}\framesubtitle{\insertsubsection}
  \begin{minipage}{0.45\textwidth}
    {\bf First Column}
    \footnotesize
    \begin{itemize}
      \item Lorem ipsum dolor sit amet.
      \item Consectetuer adipiscing elit.
      \item Aenean commodo ligula eget dolor.
    \end{itemize}
  \end{minipage}
  \begin{minipage}{0.45\textwidth}
    {\bf Second Column}
    \footnotesize
    \begin{itemize}
      \item Lorem ipsum dolor sit amet.
      \item Consectetuer adipiscing elit.
      \item Aenean commodo ligula eget dolor.
    \end{itemize}
  \end{minipage}
}
\frame{\frametitle{\insertsection}\framesubtitle{\insertsubsection}
  Event A $\rightarrow$ Event B $\rightarrow$ Event C \\
  \begin{tikzpicture}
    \node[] (n1) {
      \begin{tabular}{cc}
        Lorem & ipsum \\
        dolor & sit \\
        amet. & Consectetuer \\
        adipiscing & elit.
      \end{tabular}
    };

    \node[right=2cm of n1] (n2) {
      \begin{tabular}{cc}
        Aenean & commodo \\
        ligula & eget \\
        dolor. &
      \end{tabular}
    };
    \draw[to] (n1) -- node[midway,above]{Event C} (n2);
  \end{tikzpicture}
}